Dashboard reporting for laundry business
Hi fam, Welcome back! This time we come up with something which every laundry and dry cleaning business should be aware of. If you want long-term growth and a successful business you have to read today’s blog till the end.
So, today we will tell you about the Dashboard reporting for the laundry and dry cleaning business in 2023. What your laundry software dashboard reporting must equip with and how its graphs and metrics will help you in your business to grow faster and steadily?
Dashboard reporting
What is Dashboard reporting for the laundry business?
Dashboard reporting is the process of using visualization tools so that you can analyze the data in the form of charts, graphs, and interactive content for your laundry and dry cleaning business.
Since, These charts, metrics, and other visual aids typically represent key performance indicators (KPIs) and metrics of your laundry and dry cleaning business that you can use to track its success and operational performance. Dashboard reporting often helps you to understand and monitor information quickly without looking at spreadsheets.
QDC Software dashboard reporting tool automatically updates and generates new reports, graphs, and other interactive content to maintain the flow. The image below is the landing page of the QDC Dashboard from which you can easily check out all the metrics. It includes various filters according to the needs of the business.
Dashboard reporting for laundry

Dashboard reporting for laundry business
Below is the filter for different services that your business provides like per kg (Laundry) or per piece (Dry Cleaning). Therefore, if you want to check for per kg, you can choose it and be able to see the matrices
Dashboard reporting for laundry business.

Dashboard reporting
Below you can see that using this filter you can adjust the today, yesterday, any date, month, quarter, and year. You can even compare to the previous ones and check graphs, metrics, and numbers accordingly. Don’t you think these filters are a must-have?
Dashboard reporting for laundry

laundry busines
Why do you need dashboard reporting for your laundry and dry cleaning business?
Dashboard reporting for laundry
Well, not only the laundry and dry cleaning business but every business needs dashboard reporting. Dashboard reporting is useful for monitoring, measuring, and analyzing relevant data in Key areas. It shows you a comprehensive overview of data from different sources.
In simple terms, Dashboard takes raw data from many sources or reports and presents it in a way that’s highly tailored to the viewer’s needs. Whether you have technical knowledge or you are a non-technical person, you can read, understand and interpret it easily.
You can use dashboards to measure things like customer metrics, financial information, Feedback, orders, and many more.
Since dashboards are useful aggregation and visualization tools, they’re highly versatile—used by professionals to analyze complex data or subject matter experts to track or present data to non-subject matter experts. You can use them to understand challenges, opportunities, and where to grow and make changes.
Dashboard reporting for laundry business
What your Dashboard reporting must be equipped with?
Dashboard reporting
1) Customer Metrics
This data tells you how many total customers are there in your laundry and dry cleaning business. It will tell you the numbers of your active customers and new customers for instance(day, month, quarter year) accordingly.
Using it you can check and interpret the things going on in the process of acquisition or retention of your customers. Whether your customer retention and acquisition rate is good or not. As we know that “80% of your future profits will come from just 20% of your existing customers”. It becomes more important to think about customer retention in the Laundry business.
To know more about customer retention read our blog >> customer retention in the laundry business.
Dashboard reporting for laundry business

Dashboard reporting for laundry business
2) Revenue Metrics
This tells you about the total revenue generated by your laundry business within the chosen period. In the image given below you can see that the total revenue is Rs. 212,122.2, a red arrow which shows the drop of 13% from the last quarter ( As the filter taken is of this quarter and last quarter).
While you can even check the revenue generated per kg (Laundry) and per piece (dry cleaning) and if there is an increase or decrease as compared to the last day, month, quarter, year, or any custom period.
Dashboard reporting for laundry business

Dashboard reporting for laundry business
3) Order Metrics
These numbers tell you about the total orders in a particular period. The image below shows 260 orders and an increase in the order by 28.1% as compared to the previous month (it depends on what period you choose).
Dashboard reporting for laundry business

Dashboard reporting for laundry business
4) Feedback analytics
Your dashboard must contain the feedback metrics, it is solely responsible for many improvements to your business.
Feedback comes in different forms, positive and negative, however, no matter what, it should always be constructive to your laundry and dry cleaning business.
The images given below are part of the QDC Dashboard tool, from which you can check the feedback records at a glance. You can get the record of total negative and positive feedback from your customer, how much feedback was sent and received, and the net feedback score of any period.
Dashboard reporting for laundry business


Dashboard reporting for laundry business
5) Data Visualization of orders
Every dashboard must contain the order graph representation, we can easily compare a particular day, month, year, or any period. The most important thing is that you can discover the trends in order of data. For example in winter, every laundry and dry cleaner receives more orders than in summer.
In the image below, you can see the QDC dashboard’s order visuals. In the bar graph, you can easily analyze the number of orders this year as compared to the last year during each month.
It is quite easy to understand these data in visuals or graphs and you can catch the information at a glance. In the second graph, you can check the orders cumulatively (increasing by successive additions).
If you find your graph not going up to the mark or your expectation, you can take action and think of some other marketing or sales plan.
Above all Dashboard reporting for laundry business

Dashboard reporting for laundry business
6) Data visualization of new customers orders
An acquisition is a great way for a company to achieve rapid growth over a short period.
An acquisition can help to increase the market share of your company quickly. Even though competition can be challenging, growth through acquisition can help gain a competitive edge in the marketplace. Now you know why all businesses take care of acquisition in their business. So, it is way important in our laundry business also.
From this part of your dashboard reporting, you will get the data about the new customers. Whether you are getting new customers or not, your acquisition strategy is going well or needs any changes. How much revenue in your laundry and dry cleaning business are you getting from new customers as compared to the previous year or any period?
Dashboard reporting for laundry business

Dashboard reporting for laundry business
7) Data visualization of orders by repeat customers.
This part is all about retention, Customer retention is vital in driving repeat purchases and ongoing value from your customer base. One oft-cited rule of thumb is that it costs five times as much to acquire a new customer as it does to retain an existing customer.
This part of the dashboard will give you the data about the orders that you receive from your existing customers. By this, you can keep track of the health of your business.
To know more about how to retain customers in laundry and dry cleaning business click on the link : – How to Retain Customers in Dry Cleaning and Laundry Business (quickdrycleaning.com)
Dashboard reporting for laundry business

Dashboard reporting for laundry business
8) Data visualization for the revenue earned
Revenue is a Key Performance Indicator (KPI) for all businesses and therefore for our laundry and dry cleaning business also. One must keep in mind that it is very important to keep a regular check on the revenue earned and if it seems something not appropriate in this particular data/ graph, then you must take action urgently and revise all your GTM Strategies.
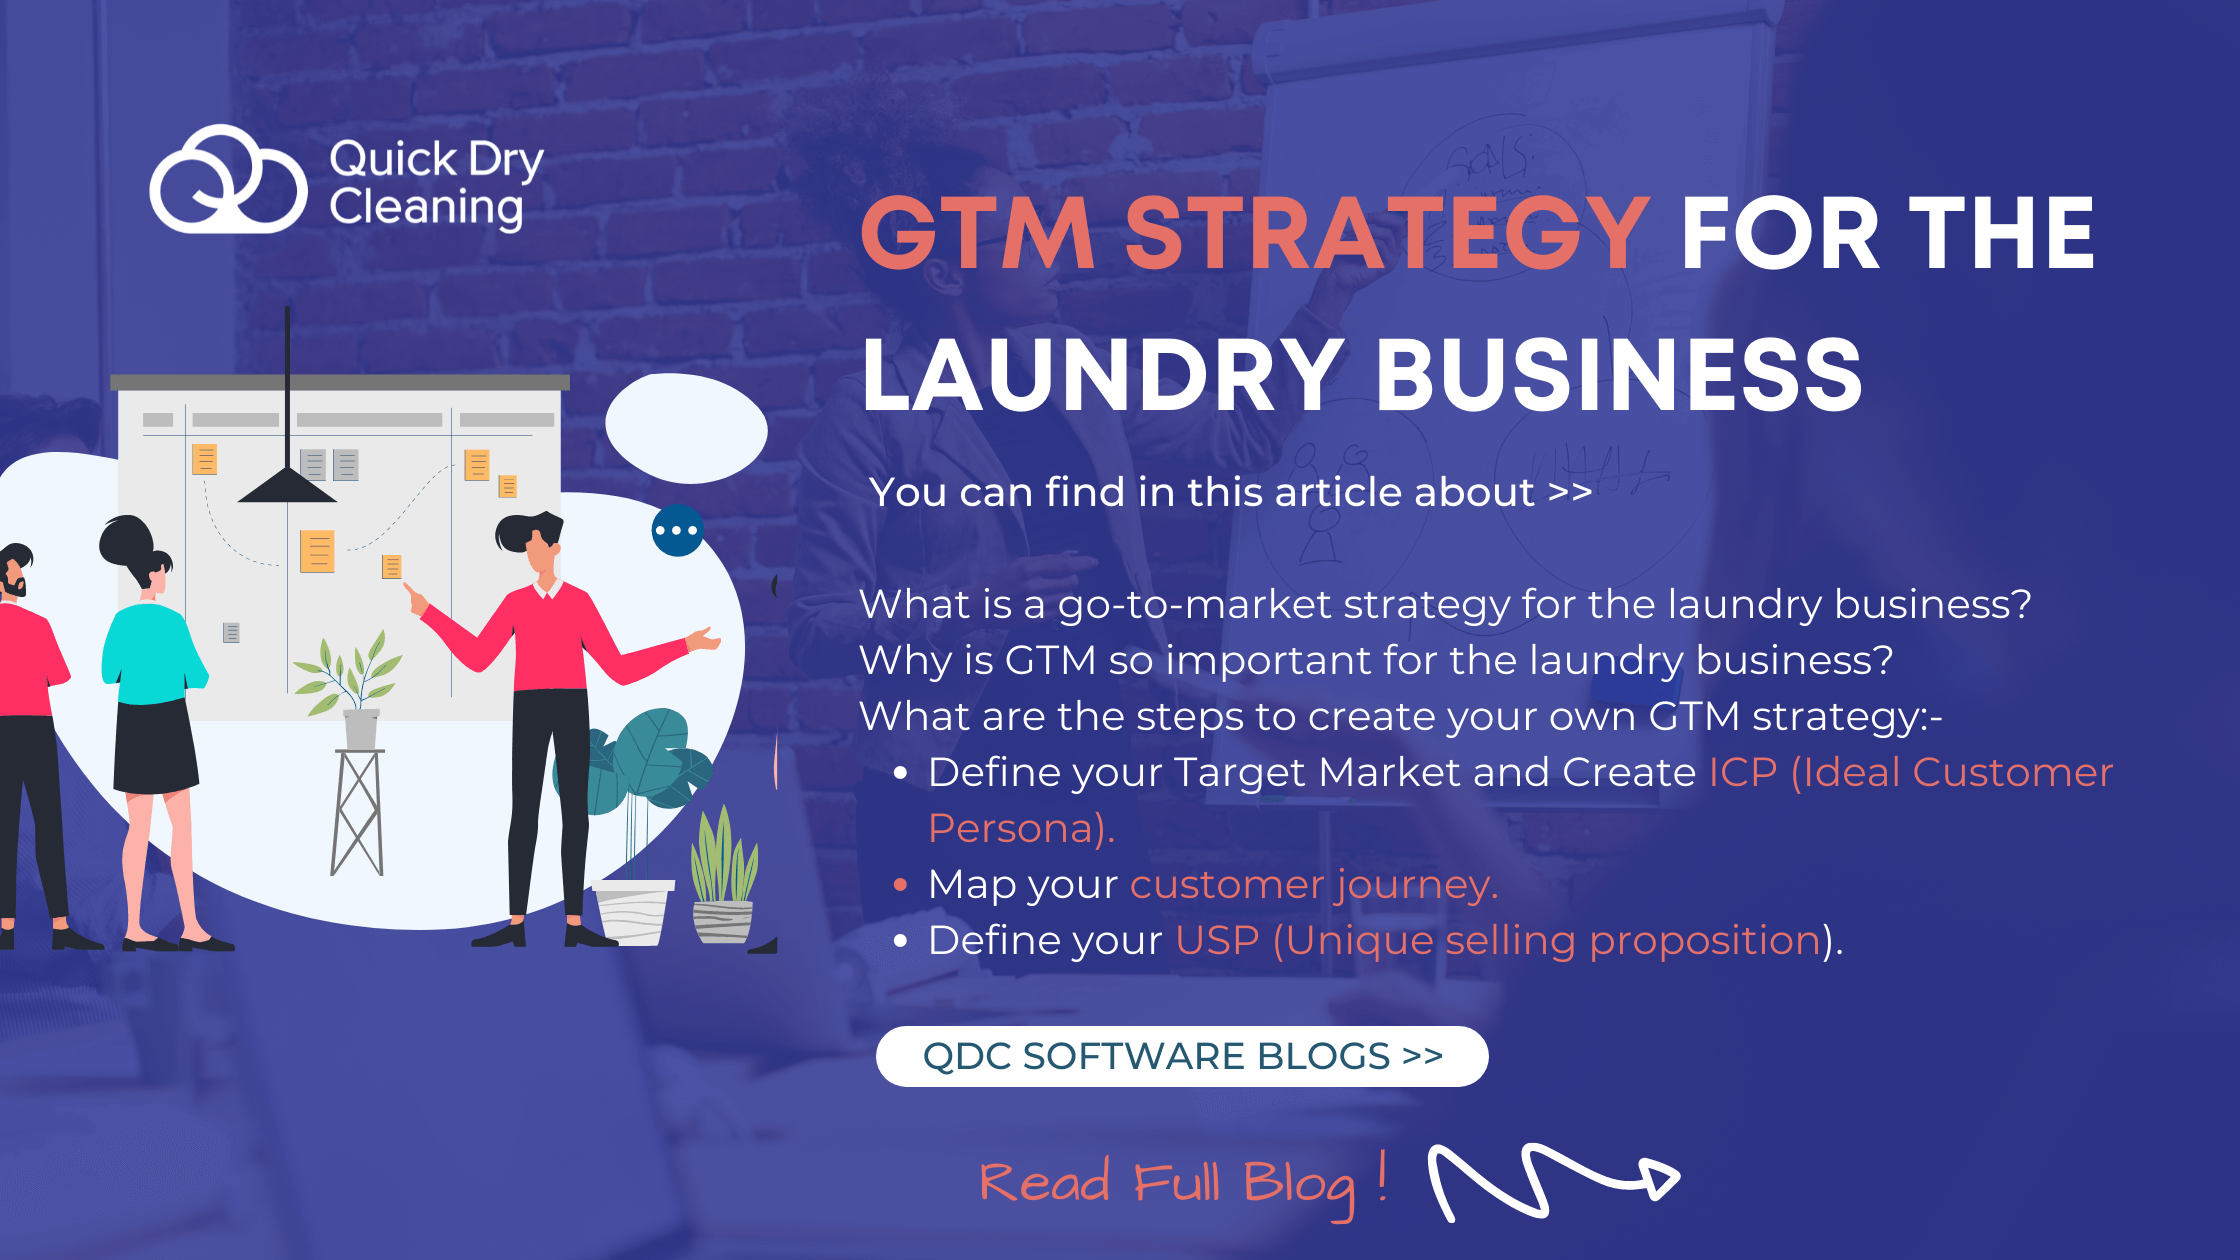
GTM(Go- to- market) Strategy will help your dry cleaning and laundry business: –
- Create a clear path for growth
- Avoid costly mistakes associated with the service launch
- Deliver a better customer experience that caters to the unique buyer’s journey
- Easily adapt to change and overcome challenges in regards to the go-to-market strategy.
- Gain a competitive advantage in your target market.
- Boost your chances of achieving a successful launch
To know more about the GTM strategy for the laundry business Click here!
Now, You must be concerned about what reports you must track for laundry business in 2022 to optimize your GTM strategy, Click here to learn about it.
above all Dashboard reporting for laundry business

Dashboard reporting for laundry business
9) Data visualization for the garment processed
It determines the garment processed for the particular time instance and tells you much about the health of your operation. You need to regularly check this data for the betterment of your laundry and dry cleaning business in the long term.
Dashboard reporting for laundry business

Dashboard reporting for laundry business
10) Revenue earned according to the customer category
The LTV (lifetime value) ratings are given to the customer by the QDC Software according to their frequency of orders and revenue earned from them. This part of the dashboard reporting tells you the revenue earned by the customer on the basis the customer categorizes these through their LTVs.
Hence, Dashboard reporting

Dashboard reporting for laundry busi
11) Active and passive customers records
Active customer: Those customers who are active and giving business during the particular time instance you prefer to check.
Passive customers: Those customers who are not active and not placing orders since that time period.
It tells you the number of active and passive customers in your laundry and dry cleaning business. For example in the image given below, the time period is set for 180 days so, in 180 days 68 customers are active and 1526 are passive ones.
Dashboard reporting

Dashboard reporting for laundry
12) Customer at Risk data representation
QDC Software tells you about your frequent customers or those who are at risk. Software forecasts the upcoming order of the customers using the trend analysis. Customers are marked at risk for your business if they do not follow up on their order trend. They might withdraw from your services. With this important data, you can take timely action and hence, you able to retain those at-risk customers.
So this representation tells you the overall view about the number of customers at risk so that you can take timely action on time if needed.
Dashboard reporting

Above all Dashboard reporting
Mr. Gaurav Nigam and Mr. Anuj Gupta, The visionaries of Tumbledry stated that to have a sustainable business by offering high-quality services. They both keep a watch on the QDC Software Dashboard reporting for the followings :
laundry business
- Repeat business
- Customer feedbacks
- Daily customer acquisitions
- Daily run-rate of revenue
- Month-on-month customer acquisition
- Revenue from repeat customers
Dashboard reporting for laundry
To know about their whole journey with the QDC read their success story now>> click on the image given below>>>
Dashboard reporting for laundry business

Dashboard reporting for laundry
QDC Software enables you the 2x growth and high revenue generation with many features that every laundry and dry cleaning business wishes for.
Start your 14 days free trial of Quick Dry Cleaning software right now >> Click Here!